Create basic Boxplot
Introduction
Boxplots are used to compare categorical variables against continuous variables and find patterns. They are used to compare the median or the 50th percentile, 25th percentile, and 75th percentile. Using the interquantile range we can find the outliers present in our data.
Boxplots are created in ggplot using the geom_boxplot(..) function and the syntax is as follows:
ggplot(data = <DATA>) + geom_boxplot(mapping = aes(<MAPPINGS>))
where,
<DATA> is our dataframe. A dataframe is a rectangular collection of variables (in the columns) and observations (in the rows).
<MAPPINGS> is where we specify the X axis data, Y axis data, color, etc.
Procedure
We will be working with the ggplot2::diamonds dataset, few rows of the data are:
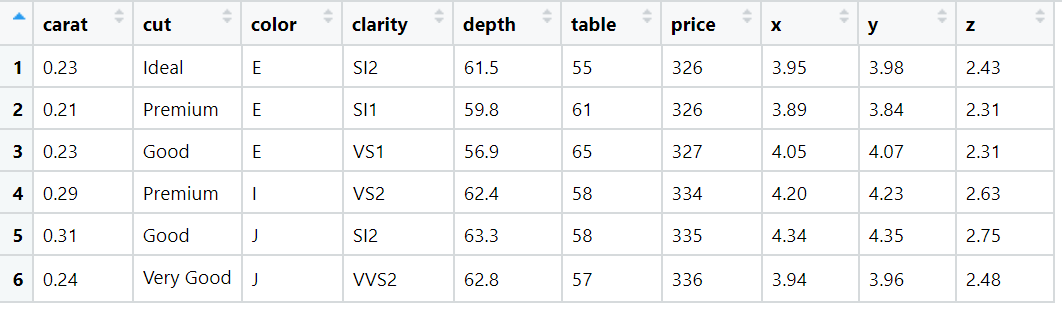
We will create basic boxplot to compare price(continuous) of diamond based on its cut(categorical).
Code
library(ggplot2)
# boxplot to compare the price of diamond based on its cut
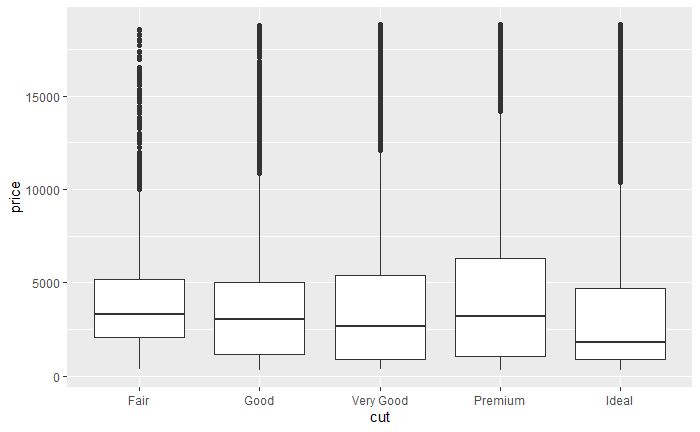
ggplot(data = diamonds) + geom_boxplot(mapping = aes(x = cut, y=price))The output of code is:
Conclusion
Thus we have successfully created basic boxplot.
References
- https://r4ds.had.co.nz/